More Plotting with PIL
First posted: Sept 19, 2004
Last Modified: Sept 19, 2004

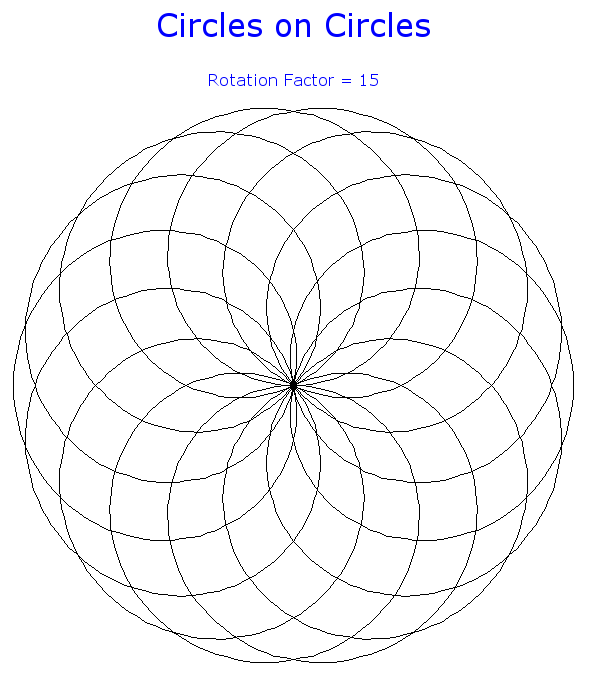
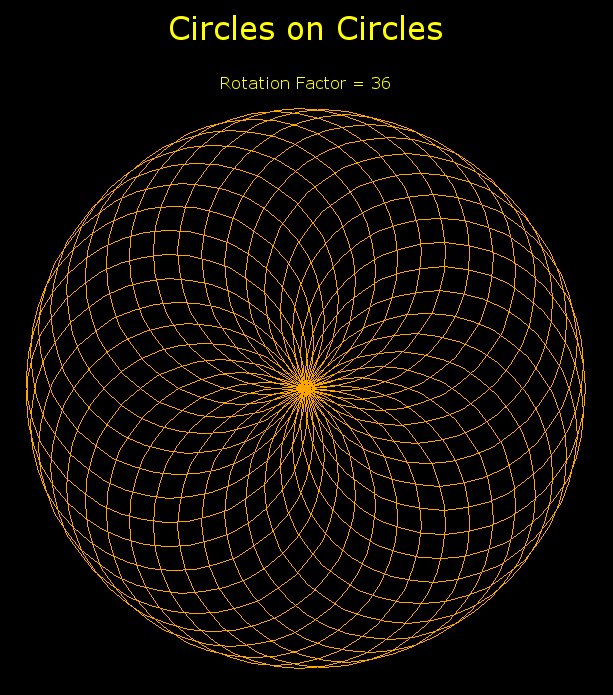
Fredrik Lundh's Python Imaging Library is useful for all sorts of geometric investigations. Above is the output of circles.py, saved in PNG format.
I derived this module from a Pascal program written by Bernie Gunn, a geochemist who does a lot of technical plotting. We were exploring whether PIL might be a useful tool for him as well. Because of its origins in Pascal, this module is more procedural in style than object oriented. Python is flexible in this way.
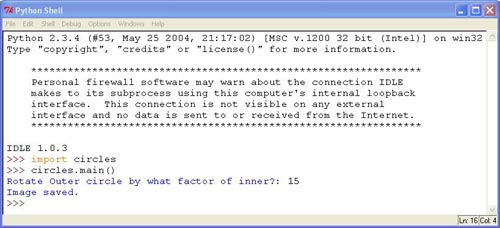
Typically of Python modules, this code may be used in two ways. In the interactive shell, it may be imported and interacted with:
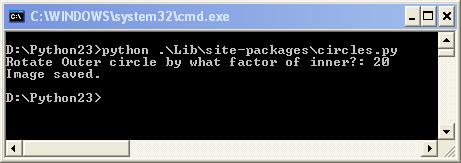
Or it may be run as a script at the command line:
In both cases a default viewer for bitmaps (xv on Linux -- must already be installed), will pop up what's about to be saved in a window.
The image.show() method used to accomplish this is apparanetly going away in PIL 1.1.5, to be replaced by other methods.
Note that circles.py has some hard-coded paths and loads a truetype font (verdana.ttf). These details are somewhat platform specific. You may need to tweak the code a little to get it working on your system.
Also, the many tweakable parameters that affect output (colors, radii of two circles, font faces) are not currently set as passable arguments. Defaults have been pre-defined, and the user has to mess with source code to play with different values.
Height and width are currently the only two arguments main() accepts.

For further reading:
- Colorized source code (and text format)
- Numeracy + Computer Literacy essay (explains povray, coords modules)
- Lorentz Attractor page (more simple source)
- Fractals Page


