2: Getting Inventive with Vectors

by Kirby Urner
First posted: Feb 15, 2000
Last modified: Oct 7, 2000

Although the concept of vector connotes something "advanced" to many ears, we should realize that even the lowly number line, first introduced in the elementary grades, is an application of Grassmann algebra -- at least according to some formalist conceptions.


This is because the real numbers, by themselves, have no spatial component. As soon as you allow yourself the freedoms of space, you must piggy-back your reals atop some system of directed elements -- the so-called "vectors".

However, since René Descartes (1596-1650) and his Cartesian coordinates take center stage earlier than the vector algebra pioneers (stars like Clifford, Hamilton, Gibbs and Grassmann), and, going further back, number and length have a quasi-prehistoric "built-in" relationship, we do not normally presuppose any knowledge of "vectors" before taking the measure of a length.


Quarternion-Driven Cube
by K. Urner


Formalist notions must take a back seat to more conventional and practical ideas about numbers.

Nevertheless, with the benefit of hindsight, it makes some sense to adopt a "single pass" approach through this topic, using a streamlined vector concept right from the beginning. This seems less artificial than repeating the historical sequence, and making vectors seem like a more complicated re-introduction to something simple.

From a pedagogical point of view, the introduction of vectors provides a natural segue from functional to object-oriented programming. Individual vectors show up as objects instantiated from the vector class.

Python 1.5.2 (#0, Apr 13 1999, 10:51:12) [MSC 32 bit (Intel)] on win32
Copyright 1991-1995 Stichting Mathematisch Centrum, Amsterdam
>>> from coords import Vector
>>> v1 = Vector((1,0,0)) # create a new vector
>>> v2 = Vector((0,1,0)) # another new vector

Each vector object encapsulates both methods and data. The methods of vector addition, scalar multiplication, dot and cross product -- even rotation around another vector -- may be internalized to these objects, plus each have their own data e.g. (x,y,z) coordinates, here stored as a 3-tuple named coords.

Our Vector class has a couple of subclasses which use the same coords variable for non-xyz data (e.g. for spherical coordinates). We use another variable, xyz, specifically for the purpose of holding Cartesian coordinates, thereby freeing coords to serve in a more generic capacity.

class Vector:

    def __init__(self,arg):
        # initialize a vector at an (x,y,z) tuple (= arg)
        self.coords = tuple(arg)
        self.xyz = self.coords

Since Python gives us power over the meanings of such primitive operators as +, - and *, we are able to devise a fairly straightforward vector notation, close enough to pre computer era text books to facilitate switching back and forth.

Below is a class method defining how the + operator will work: accept a vector as the argument of + (expressed as __add__), add it to self, and return a new vector of the same type (possibly a subclass of Vector):

    def __add__(self,v1):
        """Add a vector object to this object (self)"""        
        return self.__class__(map(add,v1.xyz,self.xyz),1)

Such "operator overloading" allows such straightforward student-Python interactions as:

>>> v3 = v1 + v2  # vector addition (v1 and v2 were instantiated above)
>>> v3.coords     # looking at (x,y,z) coordinates 
(1, 1, 0)
>>> v1.angle(v3)  # compute angular degrees between v1 and v3
45.0
>>> v4 = -v3      # negating a vector 
>>> v4.coords     # checking the resultant's coordinates 
(-1,-1,0)
>>> v5 = v3*3     # multiplying by a scalar 
>>> v5.coords     # checking the resultant's coordinates 
(3, 3, 0)
>>> v5.spherical() # any vector knows its own spherical coordinates
(4.24264068712, 90.0, 45.0)
>>> v4.length()    # any vector knows how to return its magnitude
1.41421356237
>>> v1.dot(v2)    # dot product of v1 with v2 (returns scalar)
0                 # 0 here because v1 and v2 are mutually perpendicular
>>> v3 = v1.cross(v2)  # cross product...
>>> v3.coords          # returns a new vector perpendicular to v1 & v2
(0, 0, 1)

Once we have a simple vector class defined (we can always create more methods as the need arises, in accordance with student readiness), the next step is to get some graphical output. The following primitive command set provides a good beginning:

  • point: make a sphere at the vector tip (x,y,z) -- single vector input
  • shaft: make a cylinder from (0,0,0) to (x,y,z) -- single vector input
  • edge: make a cylinder from vector tip A to vector tip B -- two vector inputs
  • face: make a surface connecting coplanar vector tips -- input list of vectors
image

The strategy employed in this essay is to make Python write text files intelligible to a completely different application, Povray. This puts Python in one of its typical roles, as a "glue language" well suited to collaborating with other, more specialized apps in a heterogenous environment.

By making Povray the workhorse, we eliminate the need to teach Python a lot of nitty gritty details. Simply provide Povray with a "shopping list" of variously sized and colored spheres and cylinders, along with their (x,y,z) coordinates, and let Povray take care of the rest. Elsewhere, we use this same strategy to write files intelligible to virtual world viewers, widely available as web browser plug-ins.

A useful strategy for generating these Povray files from Python is to define a new class, with methods taking vectors as input. Every new Povray object will come into existence by accepting a user-specified file name, creating/opening that file, and writing a default header, as per the initialization method (__init__) shown below.

Both "sphere" and "cylinder" are primitive objects in many computer graphics environments, including in Povray, with color and radius being among the user-specified properties of both. Default values for these properties are set at the class level and may be changed by the user at runtime.

"""
By Kirby Urner, 4D Solutions
Modified August 29, 2000: added render method for invoking Povray
  from within Python
Modified May 8, 2000: use xyz for 3-tuples vs coords, as coords
  may now contain 4-tuples, given Qvector subclass overrides
  this variable and uses in its own methods -- xyz common to
  Vector and all subclasses (including Svector).
Modified: Mar 5, 2000
bound some camera variables to class properties
added face() method
"""
import sys, os

class Povray:
    
    # defaults (class variables)
    cylradius = 0.02
    cylcolor  = 'Blue'
    sphradius = 0.02
    sphcolor  = 'Red'
    facecolor = 'Green'
    camfact   = 8.0
    camx      = 0.5
    wincomm   = "g:\\povray\\bin\\pvengine /NR /EXIT "
    linuxcomm = "povray +V +W640 +H480 +FC +A0.3 "
    
    def __init__(self,filename,cf=8.0,cx=0.5,cy=0.5,cz=1):
        # open Povray file, write header
        self.camfact = cf
        self.camx = cx
        self.camy = cy
        self.camz = cz
        self.file = open(filename, 'w')
        self.filename = filename
        self.header()

The Povray class even contains a render method to invoke Povray itself (or pvengine in Windows), by passing a command line to the operating system, although students may prefer to invoke Povray independently. Note that the render method depends on some default class variables (wincomm, linuxcomm) which will need to be customized to match the user's platform:

    def render(self):
        if sys.platform == 'win32':
            os.system(self.wincomm+" +I"+self.filename)
        if sys.platform == 'linux-i386':
            print "Rendering... (this will take some time)"
            os.system(self.linuxcomm+" +I"+self.filename)     

Behind the scenes, our Povray objects are writing out text strings such as those shown below (pop open povray.py for details). Our simple class methods (point, shaft, edge, face) are translating the vectors we feed them into statements about cylinders and spheres. When we have specified all the graphical elements we want, we then close the file and render it in a graphics window.


cylinder{<0, 0, 0>,<0, 0, 3>, 0.02 pigment {color Cyan} no_shadow}
cylinder{<0, 0, 0>,<0.0, 0.0, -3.0>, 0.02 pigment {color Cyan} no_shadow}
sphere{<-1.5, 2.25, 0>, 0.02 pigment {color Red} no_shadow }
sphere{<-1.49, 2.2201, 0>, 0.02 pigment {color Red} no_shadow }

The key word color coding shown above closely approximates the Povay text editor's, just as the colors in the Python code approximates those supplied by Python's IDLE, its graphical user interface.


Below is a sample interactive Python session, resulting in a "nothing special" graphic shown at right.

>>> from coords import Vector
>>> from povray import Povray
>>> myfile = Povray("example.pov") # open file
>>> v1 = Vector((4,0,0))
>>> v2 = Vector((0,0,0))
>>> v3 = Vector((-3,2,2))
>>> myfile.shaft(v1)   # line from (0,0,0) to v1
>>> myfile.sphradius = 0.2 # bigger than default
>>> myfile.point(v2)   # red sphere at the origin
>>> myfile.cylcolor = 'Green'
>>> myfile.edge(v1,v3) # from v1 to v3 tip
>>> myfile.cylcolor = 'Orange'
>>> myfile.shaft(v3)   # v3 is shown in orange
>>> myfile.facecolor = 'Yellow'
>>> myfile.face([v1,v2,v3]) # make a face
>>> myfile.close()     # close the file

image

note: appearance depends
on observer distance and angle

We now have enough infrastructure in place to graph simple functions in the (x,y)-plane. One approach is to make use the point command to place tiny spheres at every (x,f(x),0), as x goes in user-specified increments from a to b.


For example, consider the case of the parabola, with a domain of [-1.5,1.5] and increment of 0.1. First, we make the domain, using the mkdomain function. Next, we pass our domain to the mkfunction utility, which returns a set of (domain, range) pairs, using whatever rule and arguments we give it -- in this case, parabola.

def parabola(x,a=1,d=0):
    return a*(x**2) + d

Notice that our XYZ axes are in the standard left-handed arrangement, but are viewed from a somewhat non-standard angle i.e. positive X is towards the viewer, but the positive Z axis is pointed away from the eye.

image


As your students become more familiar with Povray, some will want to take control over camera angle and position -- a useful learning experience, as in the real world we always have to think about the observer in any system.

The Povray class provides some assistance with camera position by accepting two optional camera-related parameters when a Povray object is initialized, controlling viewpoint distance and x-axis location respectively. By setting the second parameter to 0, we get a "head on view" of the XY plane, except "from the back" compared to what text books usually depict.


Lets pass some camera parameters while making use of sinewave, which function likewise accepts a parameters dictionary for modulating amplitude and frequency.

def example1():
  # graphs sin(x) from -pi to pi
  set=mkdomain(-math.pi,math.pi,
         0.01)
  function = mkfunction(set,
            sinewave,
           {'a':3.0,'f':4.0,'c':0})
  myfile=povray.Povray("sine1.pov"
         ,28,0)
  xyzaxes(myfile,3)
  graphpoints(function, myfile)
  myfile.close()

The graph at right was also hand-tweeked to set the camera down on the XZ plane, vs. having it float slightly above it

image
f(x) = 3 sin (4x)


Another option, when it comes to graphing, is to use the edge command to draw segments from (x1,f(x1),0) to (x2,f(x2),0), i.e. from vector tip to neighboring vector tip.

Below is some Python code for graphing another sine wave, with x ranging from -pi to pi radians. Once again, it works by generating the domain, and passing it to mkfunction, which returns a list of (domain, range) pairs. This time, graphfunc (vs. graphpoints) applies a "connect the dots" approach to generate a fairly smooth curve.

def sinewave(x,a=1,f=1,c=0):    
    return a * math.sin(x*f - c)
def example0():
    # graphs sine wave from -pi to pi
    domain = mkdomain(-math.pi,math.pi,0.01)
    function = mkfunction(domain,sinewave)
    myfile = povray.Povray("sinewave.pov",25)
    xyzaxes(myfile,3)
    graphfunc(function, myfile)
    myfile.close()

image

To take another example, consider Pascal's Triangle from the previous section and consider the challenge of plotting a row of entries as edge-connected y-values. As x steps from -a to a, y will range from pascal(row,first) to pascal(row,last). What we expect to see is a classic Bell Curve, or Gaussian Distribution, named for Johann Carl Friedrich Gauss -- the same mathematician who featured in our opening story about triangular numbers. In section 4, we will use random trials to study this bell curve pattern in more detail.

image


from povray import Povray
from coords import Vector
import series
import functions

def gauss(n,myfile,option=1):   
    if option==1:   
       # get row n from Pascal's Triangle 
       yvals = series.prow(n)
    else:
       # use locally generated trials
       yvals = rand.binomial(n)
       
    maxy = max(yvals) # biggest yval    
    nbpoints = len(yvals)
    yscale = 3.0/maxy # scale yvals    
    xval = -4
    for i in range(1,nbpoints):        
        v1 = Vector((xval,yvals[i-1]*yscale,0))
        # increment x
        xval = xval + 8.0/(nbpoints-1)
        v2 = Vector((xval,yvals[i]*yscale,0))
        # connect v1 and v2 tips       
        myfile.edge(v1,v2)

image

>>>bellcurve.gauss(30)

Although the three examples above make use of the (x,y) plane, leaving z=0, one of the goals of the Oregon Curriculum Network is to move students "beyond flatland". Given the tremendous power of contemporary graphics tools, plus access to full-featured programming languages such as Python, students have many opportunities to get beyond the mostly planar approaches to geometry characteristic of 1900s K-12 text books. And let's not forget hands-on modeling projects!

The topic of "parametric equations" is useful for getting us off the plane. The functions.py module lays some of the groundwork for graphing functions of the form (t, Vector((a,b,c)) ), where a, b and c are obtained as functions of t, i.e. a = f(t), b=g(t), c=h(t). For a lesson plan applying these concepts, check the For Further Reading section below.

The polyhedra of course provide the paradigm on-ramp into spatial geometry. For example, consider the challenge of rendering a wire-frame icosahedron, a 20 faceted, 30 edged, 12 cornered Platonic polyhedron. We will use the already-defined Vector and Povray classes, plus develop a new Shapes class to start developing some spatial networks.

Recall the value phi from our previous section, derived from Fibonacci numbers (which we in turn extracted from Pascal's Triangle), or from a continued fraction. Phi is also equal to (1+Root(5))/2. Rectangles with dimensions 1 x phi are known as "golden rectangles", and the icosahedron may be constructed from three of these, placed in a mutually perpendicular XYZ orientation.


The animated GIF at right suggests how students may sequence their graphics to express a construction, transformation or other geometric relationship. Oft times, going from one frame to the next involves making only small modifications to the Python code.

Your students may require additional training and practice using the graphics applications specific to your classroom or home school setting.

For example, in the Windows environment, Paint Shop Pro and Animation Shop from JASC make a useful and fairly straightforward pair of tools for creating animated GIFs from Povray output files. Similar tools may be found for MacOS, Linux or other platforms.

image


You may recall from the last section that icosahedral and cuboctahedral shells contain the same number of spheres, as shown by a morphing transformation between these two shapes.

The same transformation may be described as a change from golden rectangles of 1 x phi, into squares of Root(2) x Root(2).

Six of the icosahedron's 30 edges elongate from 1 to Root(2), while the remaining 24 edges remain unit length, and comprise the 24 edges of the resultant cuboctahedron.

image

The Python module used to generate these animated GIFs (above right) takes object-oriented programming one step further, by having the Icosa and Cubocta subclasses inherit data and methods from parent classes Shape and Jitterbug. Here we have an example of "multiple inheritance", with some shapes getting the Jitterbug methods, others (such as Tetra and Cube) just inheriting from Shape.

As both of these subclasses inherit from Jitterbug, they get a list of edgepairs, which organizes 24 edges into 8 triangles. Every edge pairs two of 12 vertices obtained from three mutually perpendicular rectangles. These 12 vertices are stored in vertdict.

class Jitterbug:

    # Edges of 8 triangles defined by the 12 vertices generated
    # as the corners of (a) root2 x root2 squares (cuboctahedron)
    # or (b) 1 x phi rectangles (icosahedron)
    edgepairs = [['Axy','Axz'],['Axz','Ayz'],['Ayz','Axy'],
                ['Axy','Dxz'],['Dxz','Byz'],['Byz','Axy'],
                ['Bxy','Bxz'],['Bxz','Ayz'],['Ayz','Bxy'],
                ['Bxy','Byz'],['Byz','Cxz'],['Cxz','Bxy'],
                ['Dxy','Axz'],['Axz','Dyz'],['Dyz','Dxy'],
                ['Dxy','Dxz'],['Dxz','Cyz'],['Cyz','Dxy'],
                ['Cxy','Bxz'],['Bxz','Dyz'],['Dyz','Cxy'],
                ['Cxy','Cyz'],['Cyz','Cxz'],['Cxz','Cxy']]

    def mkrect(self,v1,v2,tag):
        # add four rectangle defined by vectors to vertdict with
        # keys 'A','B','C','D' + passed tag identifying plane
        # of the rectangle i.e. 'xy','xz' or 'yz'
        
        # Rectangle is: square when v1,v2 come from cuboctahedron
        #    "       ": golden (1xphi) when v1,v2 from icosa
        self.vertdict['A'+tag] =  v1 + v2
        self.vertdict['B'+tag] = -v1 + v2
        self.vertdict['C'+tag] = -v1 - v2
        self.vertdict['D'+tag] =  v1 - v2

Where the shapes differ is in the dimensions of these three rectangles: 1 x phi (golden rectangles) in the case of the icosahedron, Root(2) x Root(2) in the case of the cuboctahedron. These differences show up in the subclass definitions:

class  Icosa(Jitterbug,Shape):
  def  __init__(self):
     # make 3 golden rectangles 
     # of 1 x phi in the
     # xy, xz and yz planes.
     # The resulting vertices
    # will be those of the 
     # icosahedron
                            
     # xy plane
     tag = "xy"
     v1 = Vector((0.5,0.0, 0.0))
     v2 = Vector((0.0,phi/2.0,0.0))
     self.mkrect(v1,v2,tag)

     # xz plane
     tag = "xz"
     v1 = Vector((phi/2.0,0.0,0.0))
     v2 = Vector((0.0, 0.0,0.5))
     self.mkrect(v1,v2,tag)

     # yz plane
     tag = "yz"
     v1 = Vector((0.0,0.0,phi/2.0))
     v2 = Vector((0.0,0.5,0.0))
     self.mkrect(v1,v2,tag)
class  Cubocta(Jitterbug,Shape):
  def  __init__(self):
     # make 3 squares 
     # of root2 x root2 
     # in the xy, xz and yz planes.
     # The resulting vertices
     # will be those of the 
     # cuboctahedron        
 
     # xy plane
     tag = "xy"
     v1 = Vector((root2/2.0,0.0,0.0))
     v2 = Vector((0.0,root2/2.0,0.0))
     self.mkrect(v1,v2,tag)

    # xz plane
     tag = "xz"
     v1 = Vector((root2/2.0,0.0,0.0))
     v2 = Vector((0.0,0.0,root2/2.0))
     self.mkrect(v1,v2,tag)

     # yz plane
     tag = "yz"
     v1 = Vector((0.0,0.0,root2/2.0))
     v2 = Vector((0.0,root2/2.0,0.0))
     self.mkrect(v1,v2,tag)    

The octahedron may also be constructed out of 3 mutually perpendicular squares, in this case intersecting at their corners, instead of at mid-edges. Once we draw the three squares, the edge network is complete. The edgedict variable is not needed and gets set to an empty list.

The Octa class demonstrates method overriding, a characteristic technique when writing object-oriented programs. Overriding function definitions allows a subclass to present the same interface to the outside world as its base class, but to respond with specific, appropriate behaviors.


For example, instead of inheriting the mkrect function from Jitterbug, Octa gets its own version -- one which aligns its corners with the XYZ axes, as shown at right in blue.

>>> import povray, shapes, functions
>>> myfile=povray.Povray("octa.pov")
>>> functions.xyzaxes(myfile,2)
>>> myfile.cylcolor = 'Yellow'
>>> oCubocta = shapes.Cubocta()
>>> oCubocta.drawself(myfile)
>>> myfile.cylcolor = 'Blue'
>>> oOcta = shapes.Octa()
>>> oOcta.drawself(myfile)
>>> myfile.close()
image

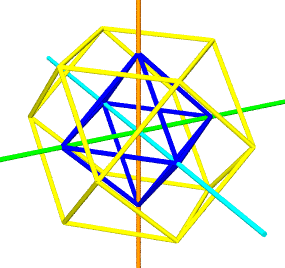
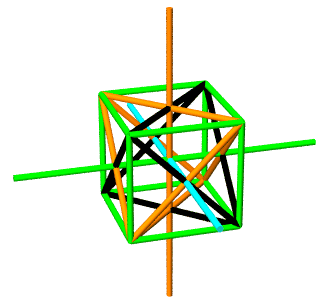
The yellow cuboctahedron shown above is defined by 12 vectors from the origin, all of the same length. The same 12 vertices may be obtained by tightly packing 12 spheres around a nuclear sphere. Given we have set the distance from the origin to any of the surrounding vertices at 1, it follows that the spheres have a diameter of 1, a radius of 1/2.

>>> import shapes
>>> ocubocta = shapes.Cubocta()          # define a cuboctahedron
>>> radii = []                           # empty list
>>> for i in ocubocta.vertdict.values(): # step through vertices...
         radii.append(i.length())        # ...adding lengths to list

>>> radii                                # show list
[1.0, 1.0, 1.0, 1.0, 1.0, 1.0, 1.0, 1.0, 1.0, 1.0, 1.0, 1.0]
>>> oCubocta.volume()
20.0

In the last section of this essay, we briefly introduce the Qvector and Svector subclasses of Vector, which are initialized with quadray and spherical coordinates respectively. Below is a table listing the quadray and spherical coordinates of the yellow cuboctahedron shown above. A few similar utilities for listing formatted data are appended to the end of shapes.py.

>>> def  table(): 
    print "     quadray              spherical  "      # header line
    print "-------------------------------------"     # header line
    for i in ocubocta.vertdict.values():
       print "%s %s" % ((i.quadray()),(i.spherical())) # data lines

>>> table()
     quadray              spherical  
-------------------------------------
(2.0, 1.0, 1.0, 0.0) (1.0, 45.0, 90.0)
(0.0, 2.0, 1.0, 1.0) (1.0, 90.0, 135.0)
(2.0, 0.0, 1.0, 1.0) (1.0, 90.0, 45.0)
(0.0, 1.0, 2.0, 1.0) (1.0, 135.0, 180)
(0.0, 1.0, 1.0, 2.0) (1.0, 135.0, -90.0)
(2.0, 1.0, 0.0, 1.0) (1.0, 45.0, 0.0)
(1.0, 1.0, 0.0, 2.0) (1.0, 90.0, -45.0)
(1.0, 0.0, 1.0, 2.0) (1.0, 135.0, 0.0)
(1.0, 0.0, 2.0, 1.0) (1.0, 135.0, 90.0)
(1.0, 2.0, 1.0, 0.0) (1.0, 45.0, 180)
(1.0, 2.0, 0.0, 1.0) (1.0, 45.0, -90.0)
(1.0, 1.0, 2.0, 0.0) (1.0, 90.0, -135.0)

Looking in the spherical column, we find all vectors are of length 1.0 (as expected), with three groups of four vectors each at 45, 90 and 135 degrees from the Z-axis in the YZ plane. These correspond the the four squares perpendicular to the orange Z-axis in the above rendering, with the equatorial square consisting of root(2) face diagonals (not part of the figure). Each group contains two pair of oppositely pointing vectors in the XY plane, e.g. 90 and -90.

Quadrays derive from four basis rays pointing from the origin to the four corners of a regular tetrahedron, labeled (1,0,0,0)(0,1,0,0)(0,0,1,0) and (0,0,0,1). This tetrahedron is constructed from four closest-packed equiradius spheres. Given we have assumed unity as the sphere diameter, these spheres have a radius of 0.5, and the tetrahedron has edges of unit length. The twelve cuboctahedral vectors, expressed in quadray format, consist of all permutations of {2,1,1,0} -- note that we do not need negative numbers, no matter which way a vector points from the origin.

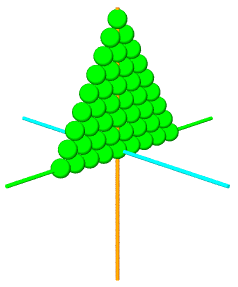
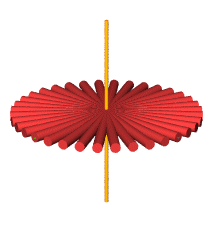
Some of the vector-based algorithms we will find especially useful in the next section use the Povray class methods to display a triangular sphere packing with a user-specified number of rows. For example, tripack centers the packing over the origin, and places the bottom row of spheres along the x-axis. The code below shows a function making use of tripack (see module).

import povray
import coords
import functions

def mkpacking(n):
    # main (open, write, close)
    myfile = povray.Povray("tripack1.pov")
    myfile.sphradius = 0.1
    myfile.sphcolor = "Green"
    tripack(n,myfile)
    functions.xyzaxes(myfile,1.5)
    myfile.close()    

Usage:

>>> import packing
>>> packing.mkpacking(9)
image


Whereas vectors do make an appearance in contemporary high school math classes, quaternions have generally been considered exclusively college material -- and for math and physics majors at that.

However, without going into a lot of detail, we might usefully touch on them at this juncture, given that quaternions:

  • use already-defined vector operations
  • have application in computer games as rotators
  • may be compared with matrix methods for accomplishing the rotation function
  • bridge to both complex numbers, and matrices
  • provide an example of an algebra with a non-commutative binary operator
  • provide another opportunity to reinforce the object-oriented approach
  • provide another opportunity for play and exploration in Python's interactive environment
  • foster greater appreciation for the history and literature of mathematics
  • may crop up again later in a student's career

Quaterions are so-called because they contain four data elements, a scalar part (one element) and a vector part of three elements, i.e. (x,y,z). Notation such as q = [s,v] is typical in text books. So in Python, we will import our already-defined Vector class in the coords module, and use it to manage the vector part of our new Quaternion class:

# by K. Urner
# last modified Feb 20, 2000
from coords import Vector
import math

class  Quaternion:

    def  __init__(self,s1,v1):
       # initialize a Quaternian as [s1,v1]
       self.s = float(s1)  # a scalar
       self.v = v1         # a Vector

When two quaternions multiply, using the * symbol (which we can define using __mul__), their scalar and vector parts interact using the operations of dot and cross product, already defined for Vector objects:

    def  __mul__(self,q1):
        # multiply (self * quaternion q1) --> new quaternion 
        # scalar part = s1*s2 - v1.v2 (where s1 is self.s, v1 is self.v)
        new_s = self.s * q1.s - self.v.dot(q1.v)
        # vector part = (v1 x v2) + (s1*v2) + (s2*v1)
        new_v = self.v.cross(q1.v) + self.s*q1.v + q1.s*self.v
        return Quaternion(new_s, new_v)

The source code actually contained in the quat.py module is slightly more complicated than the above, simply because we want to use the same * operator for multiplication by a scalar, so we run some type checking tests on q1, the user's argument, to figure out what kind of multiplication is intended.

We can see that quaternion multiplication is not commutative by defining q1 and q2 at the command line, and then taking q1*q2 and q2*q1 and comparing outcomes:

>>> v1 = coords.Vector((1,0,0))  # define a vector
>>> q1 = quat.Quaternion(2,v1)   # use to define quaternion q1
>>> v2 = coords.Vector((0,1,0))  # define another vector
>>> q2 = quat.Quaternion(2,v2)   # use to define q2
>>> q3 = q1 * q2                 # q3 = product of q1 * q2
>>> q3.v.coords                  # check coords of q3's vector part
(2.0, 2.0, 1.0)                          
>>> q3.s                         # check q3's scalar part
4.0
>>> q4 = q2 * q1                 # q4 = product of q2 * q1
>>> q4.v.coords                  # check q4's vector part (different!)
(2.0, 2.0, -1.0)
>>> q4.s                         # check q4's scalar part (same)
4.0

All quaternion objects also know how to return an inverse quaternion (defined in the module), and it's by sandwiching a vector between a specially designed rotator quaternion and its inverse that we cause the vector to turn, like the hand of a clock, around some axis.

def  rotate(v1,axis,alpha):
     # rotate vector v1 around axis 'X', 'Y' or 'Z', by alpha degrees
     qr = rotator(axis,alpha)
     # sandwich v1 as a Quaternion's vector part
     # between a rotator and its inverse
     new_q = qr * Quaternion(0,v1) * qr.inv()
     return new_q.v  # return just the vector part

With the above infrastructure in place, we can write a test function which twirls the vector (1,0,0) in a circle around the y-axis in 10 degree increments, writing to a Povray file each step along the way.

>>> import quat
>>> import coords
>>> import povray
>>> import functions
>>> v1 = coords.Vector((1,0,0))
>>> myfile = povray.Povray("testquat.pov")
>>> functions.xyzaxes(myfile,1)
>>> myfile.cylcolor = "Brown"
>>> myfile.cylradius = 0.05  # fatten
>>> for i in range(36):       # range-loop
       # using quaternions as rotators!
       v1 = quat.rotate(v1,"Y",10)
       myfile.shaft(v1)       # write new v1
>>> myfile.close()
image

Now that we have a rotation method, it makes sense to incorporate it into our Shape class, from which all shapes inherit. This method simply goes through the dictionary of vertices and applies the appropriate rotator quanternion, built according to user specifications i.e. rotation axis X,Y or Z and the number or degrees.

    def rotate(self, axis, alpha):
        # axis is 'X','Y' or 'Z'
        # alpha in degrees
        for i in self.vertdict.keys():
            self.vertdict[i]=quat.rotate(self.vertdict[i],axis,alpha)

Below, we define a green cube and orange tetrahedron, rotate the tetrahedron around the X axis by 90 degrees and draw it again, this time in black.

>>> import shapes
>>> import povray,functions
>>> myfile = povray.Povray(
                 "rotate.pov",6)
>>> myfile.cylcolor="Green"
>>> cube = shapes.Cube()
>>> cube.drawself(myfile)
>>> tetra = shapes.Tetra()
>>> myfile.cylcolor="Orange"
>>> tetra.drawself(myfile)
>>> tetra.rotate('X',90)
>>> myfile.cylcolor="Black"
>>> tetra.drawself(myfile)
>>> functions.xyzaxes(myfile,1)
>>> myfile.close()
image

For further reading:

Computer Language Resources


oregon.gif - 8.3 K
Home Page